Master Forex Technical Indicators: A Comprehensive Tutorial
Whether you’re new to the world of forex or refining your skills, mastering these key technical indicators will elevate your analysis and trading strategy. This guide covers:
- Support & Resistance
- Candlestick Patterns
- Fibonacci Levels
- Trendlines
- Elliott Wave Theory
- Bollinger Bands
- Ichimoku Cloud
1. Support & Resistance (S&R): The Trading Foundation
Support and resistance are crucial zones on a chart where price tends to stall or reverse. Support is a floor where buyers enter, and resistance is a ceiling where sellers emerge. Price touching these zones multiple times strengthens their significance.Wikipedia
** Tactics:**
- Identify levels tested at least twice, aiming for a bounce or reversal.ForexBee
- Use candlestick patterns (like pin bars or engulfing bars) at these zones for high-probability entries.ForexBeehycm.com
2. Candlestick Patterns: Visual Sentiment Analysis
Candlestick charts—originating in 18th-century Japan—display price action with clarity and depth. They help traders spot market sentiment and potential reversals.Investopedia+1
Key patterns to know:
- Reversal signals: Hammer, Inverted Hammer, Morning Star, Evening Star, Engulfing, Doji, Tweezer Tops/Bottoms.WikipediaInvestopedia
- These patterns are more meaningful when they form at strong support or resistance levels.hycm.comForexBee
3. Fibonacci Retracements & Extensions: Precision Levels
Fibonacci levels offer structured zones for setting entries, stop-losses, and profit targets:
- Common retracement levels: 38.2%, 50%, 61.8%—ideal for pullback entries.InvestopediaFXSSI – Forex Sentiment Board
- Fibonacci arcs and expansion levels further enrich intraday strategy setups.FXSSI – Forex Sentiment Board
4. Trendlines: Mapping Market Direction
Drawing trendlines across swing highs and lows reveals prevailing trends and breakout points. Connect major turning points to identify dynamic support/resistance that evolves with price.
5. Elliott Wave Theory: Forecasting Market Cycles
Elliott Wave divides market movement into impulsive (5-wave) and corrective (3-wave) phases. Important wave pivots often align with Fibonacci ratios (especially wave 3’s 0.618 extension).PFOREX
6. Bollinger Bands: Volatility-Based Boundaries
This tool defines upper and lower price bands around a moving average, indicating volatility:
- Price touching outer bands coupled with other confirmations (e.g., RSI, MACD) often signals potential reversals or breakouts.FX Leaders
- Combining Bollinger Bands with Fibonacci adds precision to entry/exit decisions.FX Leaders
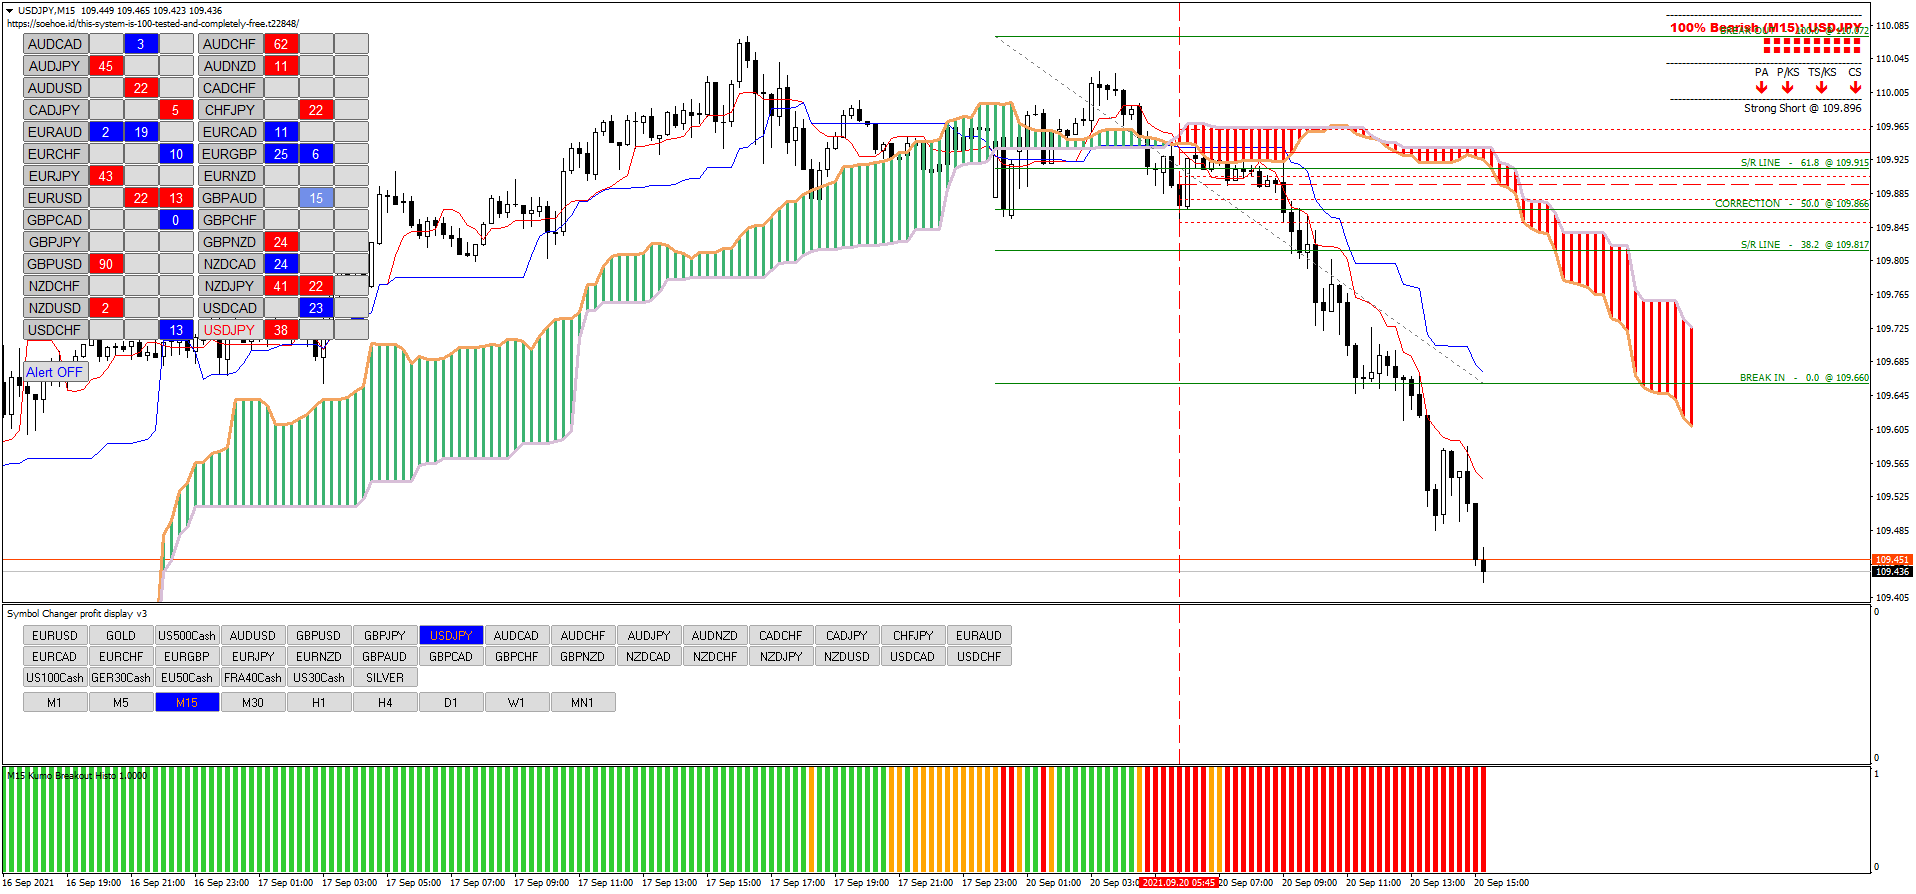
7. Ichimoku Cloud: A Holistic Forex System
Ichimoku combines trend, momentum, and support/resistance into one analytical framework.Wikipedia
Core Elements:
- Tenkan-sen & Kijun-sen: indicate momentum and act as dynamic support/resistance.
- Kumo (Cloud): projects future zones of support/resistance—cloud thickness also signals volatility strength.Wikipedia
- Chikou Span: confirms trend when it’s above or below past prices.
** Strategy Integration:**
- Pair Elliott Wave targets with Ichimoku cloud levels for more precise trade setups.Opo Finance
Putting It All Together: Integrated Strategy Flow
- Start with S&R zones (horizontal levels and trendlines).
- Watch for candlestick patterns at these zones for confirmation.
- Overlay Fibonacci levels to validate or refine entry points.
- Check for trend/volatility context using Bollinger Bands.
- Apply Ichimoku cloud insight for trend confirmation and future price projections.
- Validate setups with Elliott Wave count, aligning wave targets with technical zones.